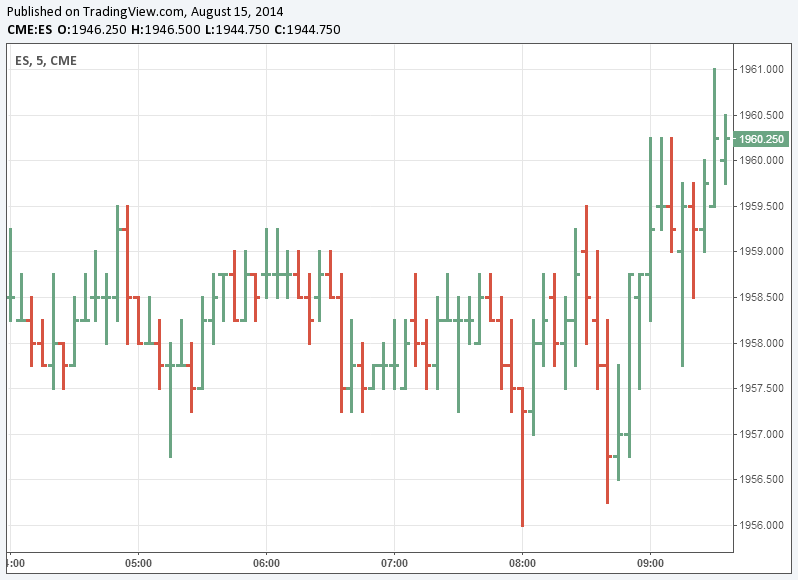
THE BAR CHART
The bar chart-
The bar chart on the other hand is a bit more versatile. A bar chart displays all the four price variables namely open, high, low, and close. A bar has three components.
1. The central line – The top of the bar indicates the highest price the security has reached. The bottom end of the bar indicates the lowest price for the same period.
2. The left mark/tick – indicates the open
3. The right mark/tick – indicates the close
For example assume the OHLC data for a stock as follows:
Open – 65
High – 70
Low – 60
Close – 68
For the above data, the bar chart would look like this
As you can see, in a single bar, we can plot four different price points. If you wish to
view 5 days chart, as you would imagine we will have 5 vertical bars. So on and so
forth.
Note the position of the left and right mark on the bar chart varies based on how the market has moved for the given day.
If the left mark, which represents the opening price is placed lower than the right
mark, it indicates that the close is higher than the open (close > open), hence a
positive day for the markets. For example consider this: O = 46, H = 51, L = 45, C =
49. To indicate it is a bullish day, the bar is represented in blue color.
Likewise if the left mark is placed higher than the right mark it indicates that the
close is lower than the open (close <open), hence a negative day for markets. For
example consider this: O = 74, H=76, L=70, C=71. To indicate it is a bearish day, the
bar is represented in red color.
The length of the central line indicates the range for the day. A range can be defined
as the difference between the high and low. Longer the line, bigger the range,
shorter the line, smaller is the range.
While the bar chart displays all the four data points it still lacks a visual appeal. This
is probably the biggest disadvantage of a bar chart. It becomes really hard to spot
potential patterns brewing when one is looking at a bar chart. The complexity
increases when a trader has to analyze multiple charts during the day.
Hence for this reason the traders do not use bar charts. However it is worth
mentioning that there are traders who prefer to use bar charts. But if you are
starting fresh, I would strongly recommend the use of Japanese Candlesticks.
Candlesticks are the default option for the majority in the trading community.


Comments
Post a Comment